The viewer
Reading the timeline: zooming, picking scripts, and inspecting values, flow and errors.
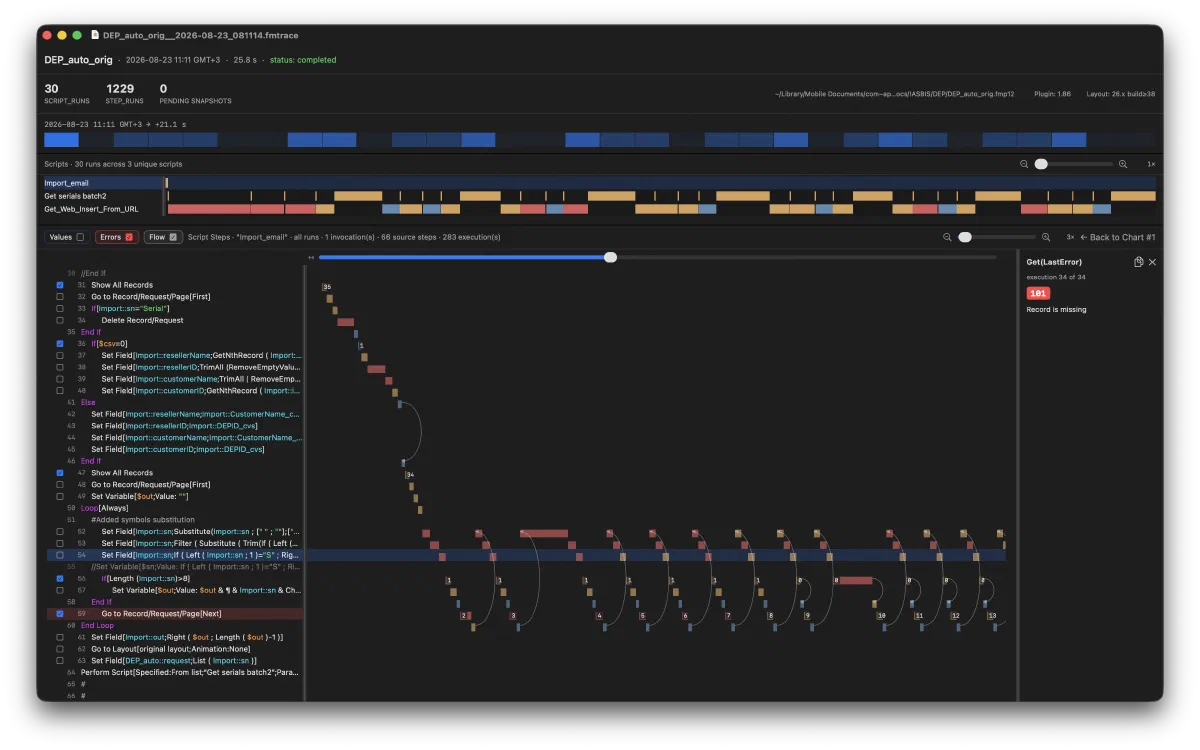
The header
Across the top: the database name, when the recording started, how long it ran, and its status. Below that, the totals for the session — script runs, step runs, pending snapshots — plus the database path, the plug-in version and the FileMaker layout build the recording came from.
The overview strip
The full duration of the recording, compressed into one bar. Denser blocks are busier stretches. Use it to find the interesting region before you zoom.
The script chart
One row per script, blocks laid out on a shared time axis. A block is one invocation; its width is how long that invocation took.
- Drag across the chart to select a region and zoom into it.
- Double-click to reset the zoom.
- Click a script name in the left column to highlight every invocation of that script.
- Click a single block to select just that invocation.
Colour follows duration, so the long red blocks are where your time went.
The step chart
Selecting a script opens its steps below: the source listing on the left, the executions on the right. The header line tells you what you are looking at — which script, how many invocations, how many source steps, how many executions in total.
Three toggles change what is drawn over the executions:
- Values marks the steps that captured a value.
- Errors marks the steps that came back with a non-zero
Get(LastError). - Flow draws the control-flow arcs — loops, conditionals, and calls into other scripts — over the step list.
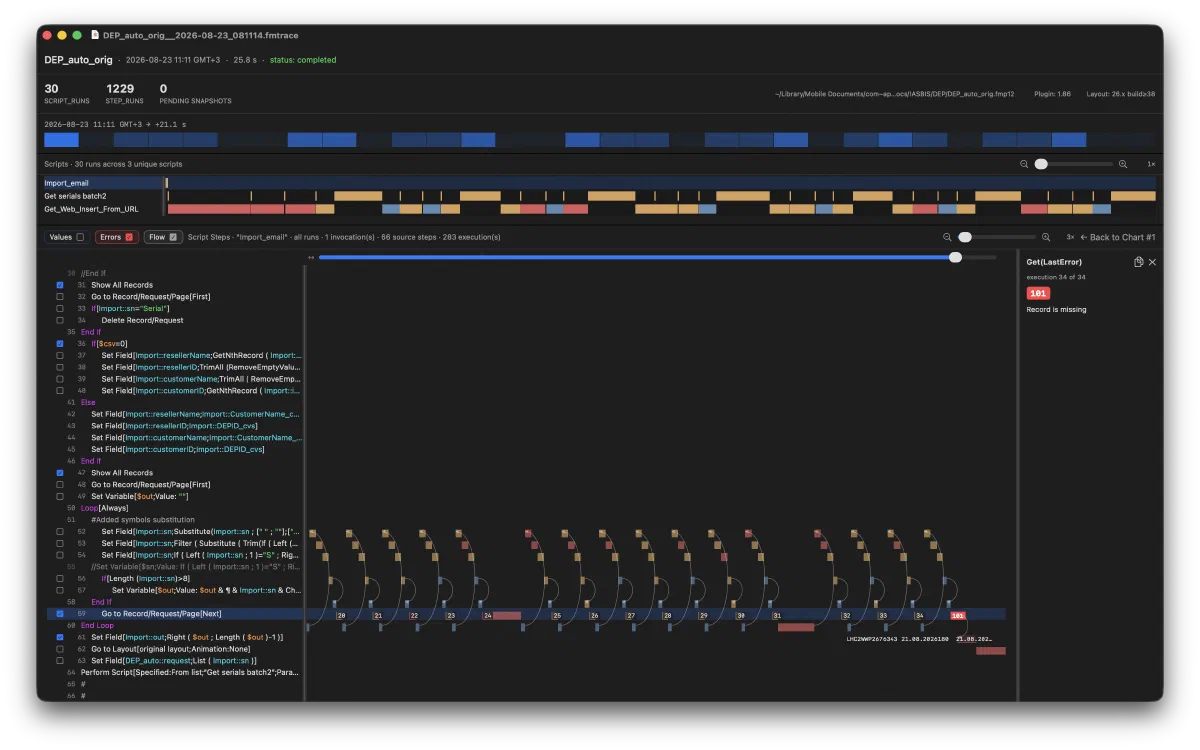
Above, the arcs repeat once per pass through the loop, and the final iteration ends in an error marker rather than another pass.
The inspector
Tick a step’s checkbox to open its captured value in the right-hand pane. The pane shows one execution at a time, with arrows to walk through the rest, a format selector (JSON and plain text), a wrap toggle, and the size of the value. Long values scroll inside the pane.
Errors open in the same pane. Selecting the marked step shows the code and the
message — 101 · Record is missing, for instance — next to the step that
produced it.
This is how you watch a variable change: tick $i in a loop and step through
the executions.